

After reading, you can build scales that mean something in your company, and read the grid without trusting it too far.
Definition
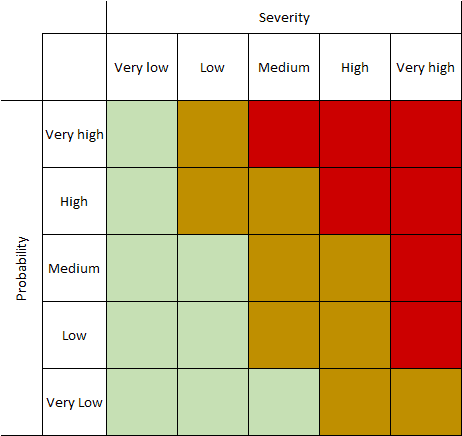
Each axis has a few levels, usually three or five. A risk takes one level on each axis, and the cell where they meet gives its rating. ISO 31000 treats consequence and likelihood as elements of risk analysis and does not impose a grid, so the matrix is a common practice and no standard requires it.
Why it matters
A warehouse fire and a leaked password have little in common until they sit on the same grid. Then a finance director and a security engineer can argue about the same two numbers.
The grid is only as good as its definitions, however. If “high” has no meaning behind it, each person in the room is scoring something different.
How it works
Begin with impact and write it in the company's own terms: money lost, days of interruption, customers affected, legal consequences. When a risk touches several of these, it takes the highest level it reaches.
Then describe likelihood in frequencies people can picture, such as “once in ten years” or “several times a year”.
Before anyone scores anything, agree which cells are acceptable, which require a plan and which go straight to management. Settling this afterwards turns the discussion into a negotiation over each risk.
A worked case
A company with €10 million in revenue builds a 5×5 grid. Impact 5 means over €500,000 or more than five days of stopped sales. Impact 3 means €50,000 to €150,000, or one day. Likelihood 4 means about once a year.
A risk rated impact 3, likelihood 4 scores 12. That puts it in amber, so a plan is due within 90 days. Anything from 15 upward goes to the managing director within a week.
Good practices
- Ask the finance team to check the figures on the impact scale. They will spot a scale that does not fit the size of the business.
- Score with the people who run the process, and write one sentence on why each score was chosen.
- Revisit the scales when the business grows. A €50,000 loss means something else at ten times the revenue.
Common mistakes
- Treating the scores as measurements. A 12 is not twice as bad as a 6: the numbers only rank the risks.
- Letting a low likelihood bury a catastrophe. Rare events that could end the business deserve their own look, whatever cell they land in.
- Adjusting the scale until the results look comfortable. The numbers improve and the risk stays exactly where it was.
- Using different scales in different departments, which makes their results impossible to compare.
Questions
- Should a risk matrix be 3×3 or 5×5?
- A 3×3 is enough for a small company starting out. Once you have many risks, a 5×5 separates them better, provided each level stays clearly defined.
- Is a risk matrix required by ISO 27001?
- No. ISO/IEC 27001 asks for defined criteria and comparable results and leaves the method open.
- Should impact and likelihood be multiplied?
- It is simple and widespread, but the product is only a ranking. Reading the cell directly is just as valid.
- Who sets the acceptance levels?
- Management does, because accepting a risk is a business decision.
- What are the limits of a risk matrix?
- It squeezes reality into few levels, so quite different risks can share a rating. Where a large investment is at stake, a quantified estimate in money can complement it.